· 6 min read
A million lines is a budget
Jonathan Blow's compile-speed target leaves only a few places to find the time: reduce the work, make it cheaper, or overlap it. The serial parts still get a vote.
A million lines per second makes a large program sound pleasantly small. Change something, compile everything, try it. Jonathan Blow named roughly that rate as a target for Jai in his 2018 Gamelab talk. He was describing where planned speedups should take the compiler. The target is worth examining on its own; it is not evidence of a current measured result.
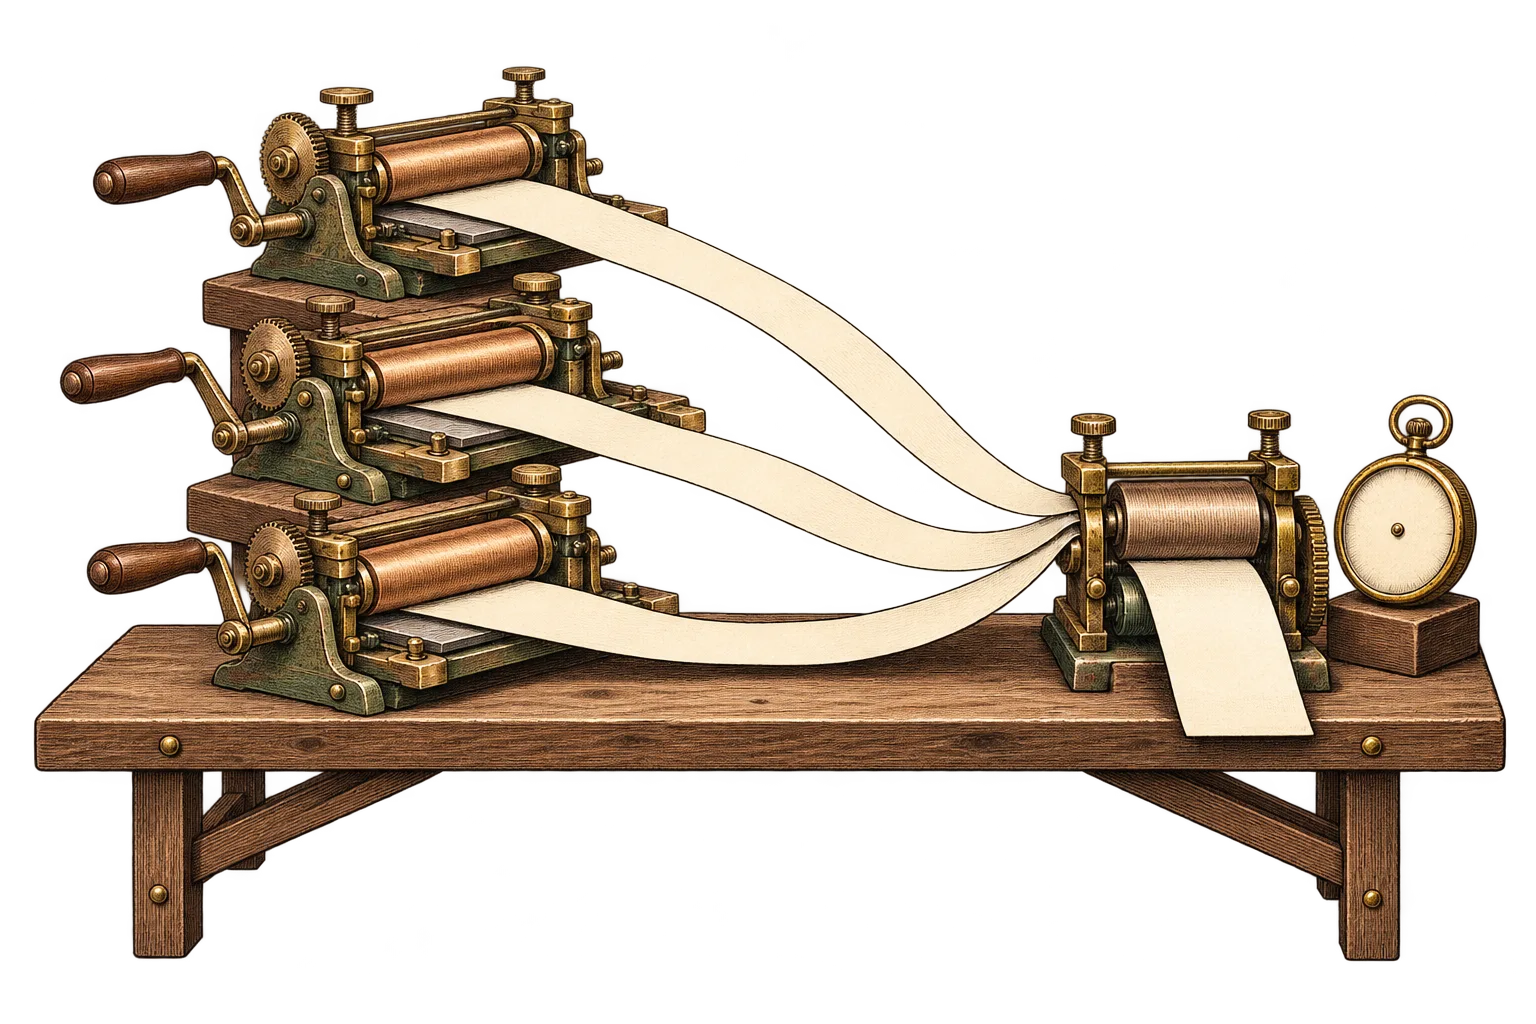
There are surprisingly few places to find that much time. For a fixed job, you can remove work, execute each unit more cheaply, or overlap work that can proceed independently. Caches remove work from later builds. More cores help with the overlap. A faster lexer makes one unit cheaper. These techniques have different ceilings, even when they all improve the same stopwatch reading.
Decide what the stopwatch includes#
Before comparing compilers, I would require the source revision, line-count convention, machine, compiler flags, target, and cache state. The interval should end when the executable is ready. Parsing a million lines and emitting an optimized, linked program from those lines are very different amounts of work.
Lines also vary. A declaration can instantiate many generic bodies or trigger a large compile-time computation. Blank lines cost almost nothing. There cannot be a universal throughput guarantee for arbitrary programs with arbitrary build-time work. A useful target needs a representative corpus, including failures and the diagnostics they produce.
Here is a deliberately rough budget. One core running at 4 GHz has about 4,000 cycles per source line at a million lines per second. Those cycles must cover every stage assigned to that core. They are cycles, not instructions, and cache misses can consume them without much useful work. This is an illustrative calculation, not a measurement of Jai.
Remove repeated work first#
My first target would be avoidable visits to the same information: reparsing shared declarations, repeatedly looking up identical names, walking the same tree for facts a previous pass already knew. Then I would look at representation. Compact arrays and integer handles can reduce allocation and pointer chasing. Fewer bytes per node can help several stages at once, provided decoding them does not cost more than it saves.
There is a concrete example in Zig's July 2025 AArch64 backend report: its second liveness pass also produces machine-level intermediate instructions. The design combines work that had required separate traversals. Instruction encoding also moves onto code-generation workers instead of the linker thread. That changes both the amount of work and where it can run.
A development backend is another large lever. Cheap code generation can get a correct executable onto the screen while a separate release path spends more time optimizing. The useful comparison includes runtime performance and debug information. A quick build that makes the next test painfully slow has merely moved the wait.
More cores meet the serial part#
Imagine a million-line build taking ten seconds on one worker. Two seconds are serial; eight can be split perfectly. With P workers the ideal time is 2 + 8 / P seconds. This is Amdahl's law applied to an invented workload, with scheduling and memory contention generously ignored.
| Workers: 1 | 100k lines/s |
|---|---|
| Workers: 4 | 250k lines/s |
| Workers: 16 | 400k lines/s |
| Workers: 64 | 471k lines/s |
Sixty-four workers still miss the target. To reach a million, this example must reduce the serial work too. A dependency chain can impose the same kind of limit: ten tiny tasks that each need the previous result cannot run together just because ten cores are available.
Zig's June 2025 parallel code-generation report describes semantic analysis on one thread feeding code-generation workers, with another thread linking results. That is useful overlap, with visible limits. LLVM's ThinLTO takes another approach: compact module summaries support global analysis, followed by parallel backend work. Both examples make the work separable before adding workers.
I would aim for that separation at function or module boundaries, keep temporary state local to a worker, and measure queue contention. Shared tables, tiny jobs, memory bandwidth, and a final output stage can consume the expected gain. SIMD belongs in this plan when profiling finds regular scans; putting the whole type checker on a GPU would be a much larger bet on having enough uniform, independent work.
Keep two scoreboards#
Incremental compilation can be the best answer to an ordinary edit. It is allowed to skip almost everything. A clean-build target asks how quickly the compiler handles the whole job, so both measurements deserve their own row. The same applies to a warm filesystem cache versus reused semantic or machine-code artifacts.
| Build | Question |
|---|---|
| Clean, development | How soon can the whole program run? |
| One function edited | How soon can I test this change? |
| Shared type edited | How far does invalidation spread? |
| Optimized release | What build cost buys the required runtime speed? |
My order would be: profile the complete build, remove duplicated work in its dominant stages, make a fast development backend, then parallelize independent jobs and shorten the remaining serial path. For C and C++, Clang's timing and resource reports help locate those costs. The exact order after profiling should follow the measured bottleneck; a linker dominating the build moves to the front of the queue.
Track elapsed time, CPU time, peak memory, and the spread across repeated runs. Keep correctness, diagnostics, and executable behavior in the comparison. The million-line ambition becomes useful when each change can answer a smaller question: which work disappeared, which work got cheaper, and which waiting period got shorter?